懿说学区(9) | SPSS统计分析(19)独立样本T检验实例操作
/Yishuo school district (9) | SPSS statistical analysis (19) independent sample t-test example operation/


“分享兴趣,传播快乐,增长见闻,留下美好! 大家好,这里是小编。欢迎大家继续访问学苑内容,我们将竭诚为您带来更多更好的内容分享。
"Share interests, spread happiness, increase knowledge, and leave beauty! Hello, everyone, this is Xiaobian. Welcome to continue to visit the content of the school, and we will wholeheartedly bring you more and better content sharing.
上一期我们进行了独立样本T检验的一般理论学习,了解了独立样本T检验的具体内容和应用场景,这一期,我们将利用一个实例场景讲解在SPSS软件中如何进行独立样本T检验的操作。
In the last issue, we learned the general theory of independent sample t-test, and learned the specific content and application scenarios of independent sample t-test. In this issue, we will use an example scenario to explain how to conduct independent sample t-test in SPSS software.
//

在两样本来自正态总体且相互独立的前提下,独立样本T检验作为假设检验的一种方法,其基本步骤与假设检验的步骤是一样的。
On the premise that two samples come from normal populations and are independent of each other, the basic steps of independent sample t-test as a method of hypothesis test are the same as those of hypothesis test.
//
实例场景:为比较两种不同品种玉米的产量,分别统计了8个地区的单位面积产量,具体数据如表所示,假定样本服从正态分布,且两组样本相互独立,试比较在置信度为95%的情况下,两种玉米产量是否有显著性差异。
Example scenario: in order to compare the yields of two different varieties of corn, the yields per unit area of eight regions are counted respectively. The specific data are shown in the table. Assuming that the samples obey the normal distribution and the two groups of samples are independent of each other, try to compare whether there is a significant difference in the yields of the two kinds of corn with a confidence of 95%.

//

第一步,在SPSS中建立有关“品种”,“产量”的变量,并录入数据。
The first step is to establish variables related to "variety" and "yield" in SPSS and enter data.

第二步,在菜单栏中选择“分析->比较平均值->独立样本T检验”的路径,打开“独立样本T检验”的对话框,按照图片所示进行操作设置,并确定置信水平。
Step 2: select the path of "analysis - > compare average - > independent sample t-test" in the menu bar, open the dialog box of "independent sample t-test", set the operation as shown in the picture, and determine the confidence level.


第三步,点击确定,软件给出运行结果,我们根据所学知识对运行结果进行分析。
Step 3: click OK, and the software will give the running results. We will analyze the running results according to the knowledge we have learned.

//
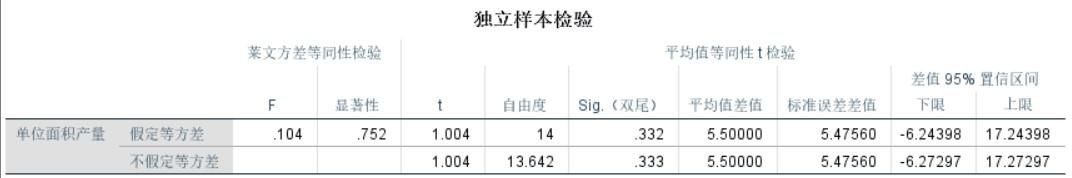
表中给出了两种T检验的结果,分别为在样本方差相等情况下的一般T检验结果和在样本方差不等情况下的校正T检验结果。数理统计学中检查不同样本的总体方差是否相等即方差齐性检验通常采用Hartley检验、Bartlett检验、Levene检验方法。表中的“莱文方差等同性检验”一项,采用莱文(Levene)方法检验方差齐性结果。
The results of two t-tests are given in the table, which are the general t-test results under the condition of equal sample variance and the corrected t-test results under the condition of unequal sample variance. In mathematical statistics, Hartley test, Bartlett test and Levene test are usually used to check whether the total variance of different samples is equal, that is, the homogeneity test of variance. In the "Levine variance equivalence test" in the table, Levine method is used to test the homogeneity of variance results.
//
对于齐性,这里采用F检验,表中第二列是F统计量的值,为0.104,第三列对应的是概率P值,为0.752.如果显著性水平为0.05,由于概率P值大于0.05.可以认为两个总体的方差无显著性差异,即方差具有齐性。
For homogeneity, F test is used here. The second column in the table is the value of F statistic, which is 0.104, and the third column corresponds to the probability p value, which is 0.752. If the significance level is 0.05, because the probability p value is greater than 0.05, it can be considered that there is no significant difference in the variance of the two populations, that is, the variance is homogeneous.
//
在方差具有齐性的情况下,独立样本T检验的结果应该看表中的“假定等方差”一行,第五列为对应的双尾检测概率0.332,在显著性水平为0.05的情况下,T统计量的概率P值大于0.05,故不应拒绝原假设。因此认为两样本的均值是相等的,在本例中,不能认为两种玉米品种的产量有显著性差异。
In the case of homogeneity of variance, the results of t-test of independent samples should see the row of "assumed equal variance" in the table, and the fifth column shows the corresponding two tailed detection probability of 0.332. When the significance level is 0.05, the probability p value of t-statistic is greater than 0.05, so the original hypothesis should not be rejected. Therefore, it is considered that the mean values of the two samples are equal. In this case, it cannot be considered that there is a significant difference in the yield of the two maize varieties.
下期预告:下一节,我们将会学习
配对样本T检验的理论学习,
进一步解决
T检验实际应用中出现的问题。
In the next section, we will learn the theory of paired sample t-test and further solve the problems in the practical application of t-test.
今天的分享就到这里了
如果您对今天的文章有独特的想法
欢迎给我们留言
让我们相约明天
祝您今天过得开心快乐!
That's all for today's sharing. If you have unique ideas about today's article, please leave us a message. Let's meet tomorrow. I wish you a happy day today!
参考资料:百度百科,《SPSS 23 统计分析实用教程》
翻译:百度翻译
本文由learningyard新学苑原创,部分文字图片来源于他处,如有侵权,请联系删除
,


