python散点图
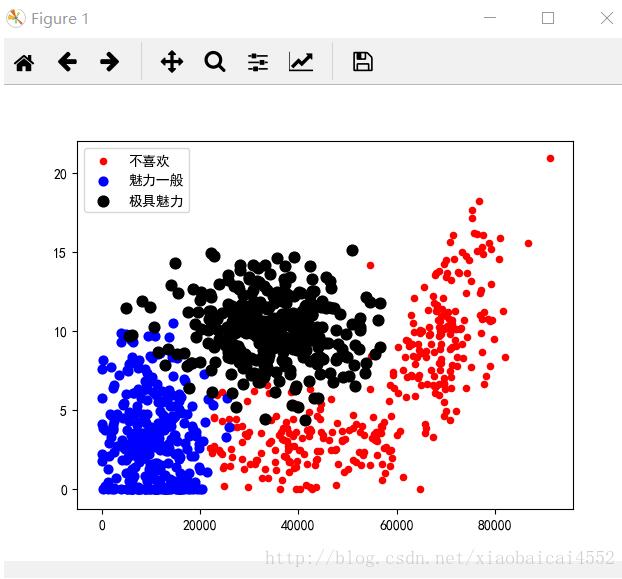
python scatter散点图用循环分类法加图例本文实例为大家分享了python scatter散点图用循环分类法加图例,供大家参考,具体内容如下
|
|
import matplotlib.pyplot as pltimport knn plt.rcparams['font.sans-serif']=['simhei']plt.rcparams['axes.unicode_minus']=false datingdatamat, datinglabels = knn.file2matrix('datingtestset2.txt') plt.figure()type1_x = [] #一共有3类,所以定义3个空列表准备接受数据type1_y = []type2_x = []type2_y = []type3_x = []type3_y = [] for i in range(len(datinglabels)): #1000组数据,i循环1000次 if datinglabels[i] == '1': #根据标签进行数据分类,注意标签此时是字符串 type1_x.append(datingdatamat[i][0]) #取的是样本数据的第一列特征和第二列特征 type1_y.append(datingdatamat[i][1]) if datinglabels[i] == '2': type2_x.append(datingdatamat[i][0]) type2_y.append(datingdatamat[i][1]) if datinglabels[i] == '3': type3_x.append(datingdatamat[i][0]) type3_y.append(datingdatamat[i][1]) plt.scatter(type1_x, type1_y, s=20, c='r', label='不喜欢')plt.scatter(type2_x, type2_y, s=40, c='b', label='魅力一般')plt.scatter(type3_x, type3_y, s=60, c='k', label='极具魅力') plt.legend()plt.show() |
用面向对象的写法:
|
|
import matplotlib.pyplot as pltimport knn plt.rcparams['font.sans-serif']=['simhei']plt.rcparams['axes.unicode_minus']=false datingdatamat, datinglabels = knn.file2matrix('datingtestset2.txt') plt.figure()axes = plt.subplot(111) type1_x = []type1_y = []type2_x = []type2_y = []type3_x = []type3_y = [] for i in range(len(datinglabels)): if datinglabels[i] == '1': type1_x.append(datingdatamat[i][0]) type1_y.append(datingdatamat[i][1]) if datinglabels[i] == '2': type2_x.append(datingdatamat[i][0]) type2_y.append(datingdatamat[i][1]) if datinglabels[i] == '3': type3_x.append(datingdatamat[i][0]) type3_y.append(datingdatamat[i][1]) type1 = axes.scatter(type1_x, type1_y, s=20, c='r')type2 = axes.scatter(type2_x, type2_y, s=40, c='b')type3 = axes.scatter(type3_x, type3_y, s=60, c='k') plt.legend((type1, type2, type3), ('不喜欢', '魅力一般', '极具魅力'))plt.show() |

以上就是本文的全部内容,希望对大家的学习有所帮助,也希望大家多多支持开心学习网。
原文链接:https://blog.csdn.net/xiaobaicai4552/article/details/79069207