云原生这么多微服务,当然需要一个诊断利器来排查问题。
Arthas 是阿里开源的 Java 诊断工具,深受开发者喜爱。在线排查问题,无需重启;动态跟踪 Java 代码;实时监控 JVM 状态。Arthas 支持 JDK 6 ,支持 Linux/Mac/Windows,采用命令行交互模式,同时提供丰富的 Tab 自动补全功能,进一步方便进行问题的定位和诊断。

官方定义为Java应用诊断利器,截至目前github收获29.4K个star。
可以用来查看线程,内存,GC和运行时状态,查看入参/返回值/异常,快速定位应用的热点,生成火焰图等功能,帮助更快排查疑难问题。本文主要讲述常见命令的使用。
常见命令启动arthas-demo(案例程序)执行如下命令下载 arthas-demo.jar,再用java -jar命令启动案例程序:
wget https://arthas.aliyun.com/arthas-demo.jar;
java -jar arthas-demo.jar
执行如下命令下载arthas-boot.jar,再用java -jar命令启动:
wget https://arthas.aliyun.com/arthas-boot.jar;
java -jar arthas-boot.jar
arthas-boot是Arthas的启动程序,它启动后,会列出所有的Java进程,用户可以选择需要诊断的目标进程。
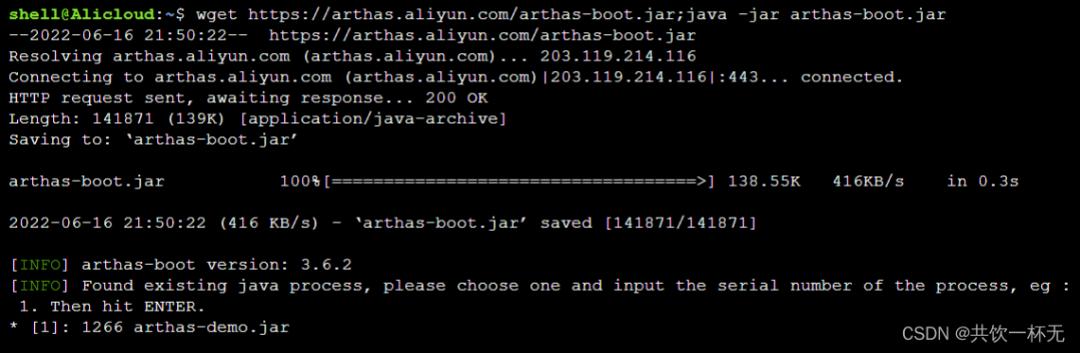
选择要诊断的Java程序,我这里输入 1 ,再按回车键(Enter)。
Attach成功之后,会打印Arthas LOGO。

输入 help 可以获取到Arthas相关命令帮助信息。
[arthas@1266]$ help
 NAME         DESCRIPTION
 help         Display Arthas Help
 auth         Authenticates the current session
 keymap       Display all the available keymap for the specified connection.
 sc           Search all the classes loaded by JVM
 sm           Search the method of classes loaded by JVM
 classloader  Show classloader info
 jad          Decompile class
 getstatic    Show the static field of a class
 monitor      Monitor method execution statistics, e.g. total/success/failure count, average rt, fail
               rate, etc.
 stack        Display the stack trace for the specified class and method
 thread       Display thread info, thread stack
 trace        Trace the execution time of specified method invocation.
 watch        Display the input/output parameter, return object, and thrown exception of specified me
              thod invocation
 tt           Time Tunnel
 jvm          Display the target JVM information
 memory       Display jvm memory info.
 perfcounter  Display the perf counter information.
 ognl         Execute ognl expression.
 mc           Memory compiler, compiles java files into bytecode and class files in memory.
 redefine     Redefine classes. @see Instrumentation#redefineClasses(ClassDefinition...)
 retransform  Retransform classes. @see Instrumentation#retransformClasses(Class...)
 dashboard    Overview of target jvm's thread, memory, gc, vm, tomcat info.
 dump         Dump class byte array from JVM
 heapdump     Heap dump
 options      View and change various Arthas options
 cls          Clear the screen
 reset        Reset all the enhanced classes
 version      Display Arthas version
 session      Display current session information
 sysprop      Display, and change the system properties.
 sysenv       Display the system env.
 vmoption     Display, and update the vm diagnostic options.
 logger       Print logger info, and update the logger level
 history      Display command history
 cat          Concatenate and print files
 base64       Encode and decode using Base64 representation
 echo         write arguments to the standard output
 pwd          Return working directory name
 mbean        Display the mbean information
 grep         grep command for pipes.
 tee          tee command for pipes.
 profiler     Async Profiler. https://github.com/jvm-profiling-tools/async-profiler
 vmtool       jvm tool
 stop         Stop/Shutdown Arthas server and exit the console.
与linux同样规则的命令此处不再赘述。如:history,cat,echo,pwd,grep。
系统的实时数据面板 dashboard 命令

dashboard 命令可以查看当前系统的实时数据面板。可以查看到CPU、内存、GC、运行环境等信息。
输入 q 或者 Ctrl C 可以退出dashboard命令。
打印线程ID 的栈 threadthread 1 命令会打印线程ID 1的栈。用 thread 1 | grep 'main(' 查找到main class。

可以通过 sc 命令来查找JVM里已加载的类,通过-d参数,可以打印出类加载的具体信息,很方便查找类加载问题。
[arthas@1266]$ sc -d *MathGame
 class-info        demo.MathGame
 code-source       /home/shell/arthas-demo.jar
 name              demo.MathGame
 isInterface       false
 isannotation      false
 isEnum            false
 isAnonymousClass  false
 isArray           false
 isLocalClass      false
 isMemberClass     false
 isPrimitive       false
 isSynthetic       false
 simple-name       MathGame
 modifier          public
 annotation
 interfaces
 super-class        -java.lang.Object
 class-loader       -sun.misc.Launcher$AppClassLoader@1b6d3586
                      -sun.misc.Launcher$ExtClassLoader@107df6e5
 classLoaderHash   1b6d3586

Affect(row-cnt:1) cost in 50 ms.
sc支持通配,比如搜索所有的StringUtils:
sc *StringUtils
查找UserController的ClassLoader
[arthas@1266]$ sc -d com.example.demo.arthas.user.UserController | grep classLoaderHash
 classLoaderHash   19469ea2
sm命令则是查找类的具体函数。比如:
sm java.math.RoundingMode
通过-d参数可以打印函数的具体属性:
sm -d java.math.RoundingMode
查找特定的函数,比如查找构造函数:
sm java.math.RoundingMode <init>
jad demo.MathGame

通过--source-only参数可以只打印出在反编译的源代码:
jad --source-only com.example.demo.arthas.user.UserController
在Arthas里,有一个单独的ognl命令,可以动态执行代码。这个有点秀啊
调用static函数
ognl '@java.lang.System@out.println("hello ognl")'
获取UserController类里的logger字段:
ognl --classLoaderClass org.springframework.boot.loader.LaunchedURLClassLoader @com.example.demo.arthas.user.UserController@logger
通过-x参数控制返回值的展开层数。比如:
ognl --classLoaderClass org.springframework.boot.loader.LaunchedURLClassLoader -x 2 @com.example.demo.arthas.user.UserController@logger
ognl '#value1=@System@getProperty("java.home"), #value2=@System@getProperty("java.runtime.name"), {#value1, #value2}'
- OGNL特殊用法请参考:https://github.com/alibaba/arthas/issues/71
- OGNL表达式官方指南:https://commons.apache.org/proper/commons-ognl/language-guide.html
watch demo.MathGame primeFactors returnObj

- sysprop :打印所有的System Properties信息。
- 指定单个key:sysprop user.dir。
- 通过grep过滤 :sysprop | grep user。
- 设置新的value:sysprop testKey testValue。
sysenv 命令可以获取到环境变量。和sysprop命令类似。
jvmjvm 命令会打印出JVM的各种详细信息。
dashboarddashboard 命令可以查看当前系统的实时数据面板。
重置增强类 reset 命令通过reset命令可以重置增强类,将被 Arthas 增强过的类全部还原,Arthas 服务端关闭时会重置所有增强过的类。Arthas在 watch/trace 等命令时,实际上是修改了应用的字节码,插入增强的代码。显式执行 reset 命令,可以清除掉这些增强代码。
reset 还原指定类:
reset demo.MathGame
还原所有增强类:
reset

类似传统的tee命令 用于读取标准输入的数据,并将其内容输出成文件。
tee指令会从标准输入设备读取数据,将其内容输出到标准输出设备,同时保存成文件。
查看当前Arthas版本 version
[arthas@1710]$ version
3.6.2
输入 exit 或者 quit 命令可以退出Arthas当前session。执行 stop 命令彻底退出Arthas。
PS:所有命令都可以通过 -h 参数查看帮助信息。
实操案例排查函数调用异常通过curl 请求接口只能看到返回异常,但是看不到具体的请求参数和堆栈信息。
查看UserController的 参数/异常
shell@Alicloud:~$ curl http://localhost:61000/user/0 {"timestamp":1655435063042,"status":500,"error":"Internal Server Error","exception":"java.lang.IllegalArgumentException","message":"id < 1","path":"/user/0"}在Arthas里执行:
watch com.example.demo.arthas.user.UserController * '{params, throwExp}'
- 第一个参数是类名,支持通配
- 第二个参数是函数名,支持通配 访问 curl http://localhost:61000/user/0 ,watch命令会打印调用的参数和异常
再次通过curl 调用可以在arthas里面查看到具体的异常信息。
把获取到的结果展开,可以用-x参数:
返回值表达式
watch com.example.demo.arthas.user.UserController * '{params, throwExp}' -x 2在上面的例子里,第三个参数是返回值表达式,它实际上是一个ognl表达式,它支持一些内置对象:
- loader
- clazz
- method
- target
- params
- returnObj
- throwExp
- isBefore
- isThrow
- isReturn
比如返回一个数组:
条件表达式
watch com.example.demo.arthas.user.UserController * '{params[0], target, returnObj}'watch命令支持在第4个参数里写条件表达式,比如:
- 当访问 user/1 时,watch命令没有输出
- 当访问 user/101 时,watch会打印出结果。
当异常时捕获
watch命令支持-e选项,表示只捕获抛出异常时的请求:
按照耗时进行过滤
watch com.example.demo.arthas.user.UserController * "{params[0],throwExp}" -ewatch命令支持按请求耗时进行过滤,比如:
热更新代码
watch com.example.demo.arthas.user.UserController * '{params, returnObj}' '#cost>200'这个也是真的秀。
访问 http://localhost:61000/user/0 ,会返回500异常:
shell@Alicloud:~$ curl http://localhost:61000/user/0
{"timestamp":1655436218020,"status":500,"error":"Internal Server Error","exception":"java.lang.IllegalArgumentException","message":"id < 1","path":"/user/0"}
通过热更新代码,修改这个逻辑。
jad反编译UserController
jad --source-only com.example.demo.arthas.user.UserController > /tmp/UserController.javajad反编译的结果保存在 /tmp/UserController.java文件里了。
再打开一个Terminal 窗口,然后用vim来编辑/tmp/UserController.java:
vim /tmp/UserController.java比如当 user id 小于1时,也正常返回,不抛出异常:
sc查找加载UserController的ClassLoader
@GetMapping(value={"/user/{id}"})
public User findUserById(@PathVariable Integer id) {
    logger.info("id: {}", (Object)id);
    if (id != null && id < 1) {
        return new User(id, "name"   id);
        // throw new IllegalArgumentException("id < 1");
    }
    return new User(id.intValue(), "name"   id);
    }
[arthas@1266]$ sc -d *UserController | grep classLoaderHash
 classLoaderHash   19469ea2
classLoaderHash 是19469ea2,后面需要使用它。
mc保存好/tmp/UserController.java之后,使用mc(Memory Compiler)命令来编译,并且通过-c或者–classLoaderClass参数指定ClassLoader:
mc --classLoaderClass org.springframework.boot.loader.LaunchedURLClassLoader /tmp/UserController.java -d /tmp
[arthas@1266]$ mc --classLoaderClass org.springframework.boot.loader.LaunchedURLClassLoader /tmp/UserController.java -d /tmp
Memory compiler output:
/tmp/com/example/demo/arthas/user/UserController.class
Affect(row-cnt:1) cost in 2879 ms.
也可以通过mc -c /tmp/UserController.java -d /tmp,使用-c参数指定ClassLoaderHash:
redefine
mc -c 19469ea2 /tmp/UserController.java -d /tmp再使用redefine命令重新加载新编译好的UserController.class:
热修改代码结果
[arthas@1266]$ redefine /tmp/com/example/demo/arthas/user/UserController.class redefine success, size: 1, classes: com.example.demo.arthas.user.UserControllerredefine成功之后,再次访问 user/0 ,结果正常
动态更新应用Logger Level查找UserController的ClassLoader
shell@Alicloud:~$ curl http://localhost:61000/user/0 {"id":0,"name":"name0"}用ognl获取logger
[arthas@1266]$ sc -d *UserController | grep classLoaderHash
 classLoaderHash   19469ea2
ognl --classLoaderClass org.springframework.boot.loader.LaunchedURLClassLoader ‘@com.example.demo.arthas.user.UserController@logger’
[arthas@1266]$ ognl --classLoaderClass org.springframework.boot.loader.LaunchedURLClassLoader '@com.example.demo.arthas.user.UserController@logger'
@Logger[
    serialVersionUID=@Long[5454405123156820674],
    FQCN=@String[ch.qos.logback.classic.Logger],
    name=@String[com.example.demo.arthas.user.UserController],
    level=null,
    effectiveLevelInt=@Integer[20000],
    parent=@Logger[Logger[com.example.demo.arthas.user]],
    childrenList=null,
    aai=null,
    additive=@Boolean[true],
    loggerContext=@LoggerContext[ch.qos.logback.classic.LoggerContext[default]],
]
可以知道UserController@logger实际使用的是logback。可以看到level=null,则说明实际最终的level是从root logger里来的。
单独设置UserController的logger level
ognl --classLoaderClass org.springframework.boot.loader.LaunchedURLClassLoader '@com.example.demo.arthas.user.UserController@logger.setLevel(@ch.qos.logback.classic.Level@DEBUG)'再次获取UserController@logger,可以发现已经是DEBUG了。
修改logback的全局logger level通过获取root logger,可以修改全局的logger level:
ognl --classLoaderClass org.springframework.boot.loader.LaunchedURLClassLoader '@org.slf4j.LoggerFactory@getLogger("root").setLevel(@ch.qos.logback.classic.Level@DEBUG)'获取Spring Context,在获取 bean,再调用函数
使用tt命令获取到spring contexttt即 TimeTunnel,它可以记录下指定方法每次调用的入参和返回信息,并能对这些不同的时间下调用进行观测。
官方tt说明:https://arthas.aliyun.com/doc/tt.html
tt -t org.springframework.web.servlet.mvc.method.annotation.RequestMappingHandlerAdapter invokeHandlerMethod访问user/1:
curl http://localhost:61000/user/1可以看到tt命令捕获到了一个请求:
输入 q 或者 Ctrl C 退出上面的 tt -t命令。
使用tt命令从调用记录里获取到spring context获取spring bean,并调用函数
tt -i 1000 -w 'target.getApplicationContext()'
tt -i 1000 -w ‘target.getApplicationContext().getBean(“helloWorldService”).getHelloMessage()’结果如下:
排查HTTP请求返回401
[arthas@1266]$ tt -i 1000 -w 'target.getApplicationContext().getBean("helloWorldService").getHelloMessage()' @String[Hello World] Affect(row-cnt:1) cost in 1 ms.请求接口没有权限的时候一般就返回401 Unauthorized。
401通常是被权限管理的Filter拦截了,那么到底是哪个Filter处理了这个请求,返回了401?
跟踪所有的Filter函数开始trace:
trace javax.servlet.Filter *可以在调用树的最深层,找到AdminFilterConfig$AdminFilter返回了401
通过stack获取调用栈
---[3.806273ms] javax.servlet.FilterChain:doFilter() | `---[3.447472ms] com.example.demo.arthas.AdminFilterConfig$AdminFilter:doFilter() | `---[0.17259ms] javax.servlet.http.HttpServletResponse:sendError()上面是通过trace命令来获取信息,从结果里,我们可以知道通过stack跟踪HttpServletResponse:sendError(),同样可以知道是哪个Filter返回了401
执行:
stack javax.servlet.http.HttpServletResponse sendError 'params[0]==401'访问可以看到如下堆栈信息:
查找Top N线程查看所有线程信息
查看具体线程的栈
thread查看线程ID 2的栈:
查看CPU使用率top n线程的栈
thread 2查看5秒内的CPU使用率top n线程栈
thread -n 3查找线程是否有阻塞
thread -n 3 -i 5000
thread -b更多使用查看:
- Github地址: https://github.com/alibaba/arthas
- 文档地址: https://arthas.aliyun.com/doc/
来源:blog.csdn.net/qq_35427589/article/details/125331696
,


