实现功能:
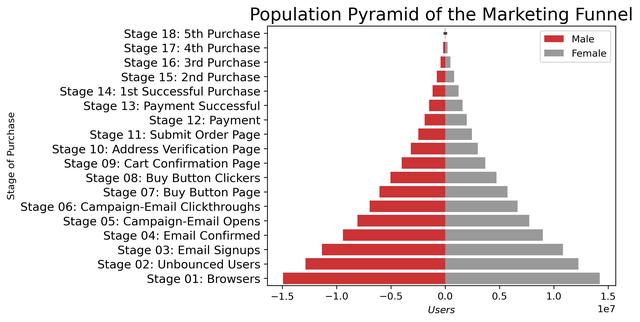
python绘制金字塔图,一种排过序的分组水平柱状图barplot,可很好展示不同分组之间的差异,可可视化逐级过滤或者漏斗的每个阶段。
实现代码:
|
1 |
import pandas as pd |
|
2 |
import matplotlib.pyplot as plt |
|
3 |
import seaborn as sns |
|
4 | |
|
5 |
# Read data |
|
6 |
df = pd.read_csv("D:\数据杂坛\datasets\email_campaign_funnel.csv") |
|
7 | |
|
8 |
# Draw Plot |
|
9 |
plt.figure(figsize=(12, 8), dpi=80) |
|
10 |
group_col = 'Gender' |
|
11 |
order_of_bars = df.Stage.unique()[::-1] |
|
12 |
colors = [ |
|
13 |
plt.cm.Set1(i / float(len(df[group_col].unique()) - 1)) |
|
14 |
for i in range(len(df[group_col].unique())) |
|
15 |
] |
|
16 | |
|
17 |
for c, group in zip(colors, df[group_col].unique()): |
|
18 |
sns.barplot(x='Users', |
|
19 |
y='Stage', |
|
20 |
data=df.loc[df[group_col] == group, :], |
|
21 |
order=order_of_bars, |
|
22 |
color=c, |
|
23 |
label=group) |
|
24 | |
|
25 |
# Decorations |
|
26 |
plt.xlabel("$Users$") |
|
27 |
plt.ylabel("Stage of Purchase") |
|
28 |
plt.yticks(fontsize=12) |
|
29 |
plt.title("Population Pyramid of the Marketing Funnel", fontsize=18) |
|
30 |
plt.legend() |
|
31 |
plt.show() |
实现效果:

喜欢记得点赞,在看,收藏,
关注V订阅号:数据杂坛,获取数据集,完整代码和效果,将持续更新!
,


