1 要点:
=====
1.1 由浅入深讲解matplotlib画矩形(正方形和长方形),多种方法实现,由简单到复杂,讲解和注释详细,适合收藏。
1.2 正方形可以实现,那么长方形也就可以实现了。
1.3 通过此方法,熟悉matplotlib作图相关知识和python编程思维。

2 方法一
======
2.1 Line2D法:画4条边的直线
2.2 代码
from matplotlib.lines import Line2D
import matplotlib.pyplot as plt

figure, ax = plt.subplots()

# 4条line的坐标点(x,y)
line1 = [(1, 1), (2, 1)]
line2 = [(2, 1), (2, 2)]
line3 = [(2, 2), (1, 2)]
line4 = [(1, 2), (1, 1)]

#打包法
(line1_xs, line1_ys) = zip(*line1)
(line2_xs, line2_ys) = zip(*line2)
(line3_xs, line3_ys) = zip(*line3)
(line4_xs, line4_ys) = zip(*line4)

# 创建4条线,并添加
ax.add_line(Line2D(line1_xs, line1_ys, linewidth=1, color='b'))
ax.add_line(Line2D(line2_xs, line2_ys, linewidth=1, color='r'))

ax.add_line(Line2D(line3_xs, line3_ys, linewidth=1, color='k'))
ax.add_line(Line2D(line4_xs, line4_ys, linewidth=1, color='y'))

# 展示
plt.plot()
plt.show()
2.3 效果图

3 方法二
=======
3.1 plot坐标点法
3.2 代码
import matplotlib.pyplot as plt

#fig,ax = plt.subplots()  #可以注释掉

#坐标点法
x=[1,2,2,1,1]
y=[1,1,2,2,1]

plt.plot(x,y)

#等同于上面
#plt.plot([1,2,2,1,1],[1,1,2,2,1])

plt.show()
3.3 效果图:省略,四条边默认颜色:b=blue
4 方法三
=======
4.1 patches(mpatches) rectangle法
4.2 代码
import matplotlib.pyplot as plt
import matplotlib.patches as patches

fig = plt.figure()
ax = fig.add_subplot(111)

rect=patches.Rectangle(
        (1, 1),   # (x,y)
        1,          # width
        1,          # height
        color='g',  #边的颜色
        fill=False  #是否填充,默认填充

    )

ax.add_patch(rect)

'''
#等同于上面
ax.add_patch(
    patches.Rectangle(
        (1, 1),   # (x,y)
        1,          # width
        1,          # height
    )
)
'''


#如果坐标点x和y不是(0,0),那么需要下面这个,否则不显示
# 设置图形显示的时候x轴和y轴等比例
ax.axis("equal")
plt.show()


'''
#另外一种
import numpy as np
import matplotlib.pyplot as plt
import matplotlib.patches as mpatches

fig, ax = plt.subplots()

# 矩形的左下角
#xy = np.array([1, 1])
xy=(1,1)

# 第二个参数和第三个参数是先长后宽
rect = mpatches.Rectangle(xy, 2, 2, color= "g")
ax.add_patch(rect)

# 设置图形显示的时候x轴和y轴等比例
ax.axis("equal")

plt.show()

'''
4.3 效果图:省略
5 方法四
=======
5.1 plt.Rectangle法

5.2 代码:
import matplotlib.pyplot as plt

'''
fig = plt.figure()
ax = fig.add_subplot(111)
'''
#等同于上面这个
fig,ax = plt.subplots()

rect = plt.Rectangle((1,1),2,2,edgecolor='g',fill=False)

ax.add_patch(rect)
#如果坐标点x和y不是(0,0),那么需要下面这个,否则不显示
# 设置图形显示的时候x轴和y轴等比例
ax.axis("equal")

plt.show()
6 方法五
======
6.1 plt.gca().add_patch(plt.Rectangle)法,最佳方法。
6.2 代码
import matplotlib.pyplot as plt

#plt.gca()获得,分别表示Get Current Axes
#plt.plot()实际上会通过plt.gca()获得当前的Axes对象ax
#有时候会写成
#ax = plt.gca()

#不能设置颜色和是否填充颜色等
plt.gca().add_patch(plt.Rectangle((1,1),2,2))

#如果坐标点x和y不是(0,0),那么需要下面这个,否则不显示
# 设置图形显示的时候x轴和y轴等比例
plt.gca().axis("equal")  #ax.axis("equal")
plt.show()
7 方法六
======
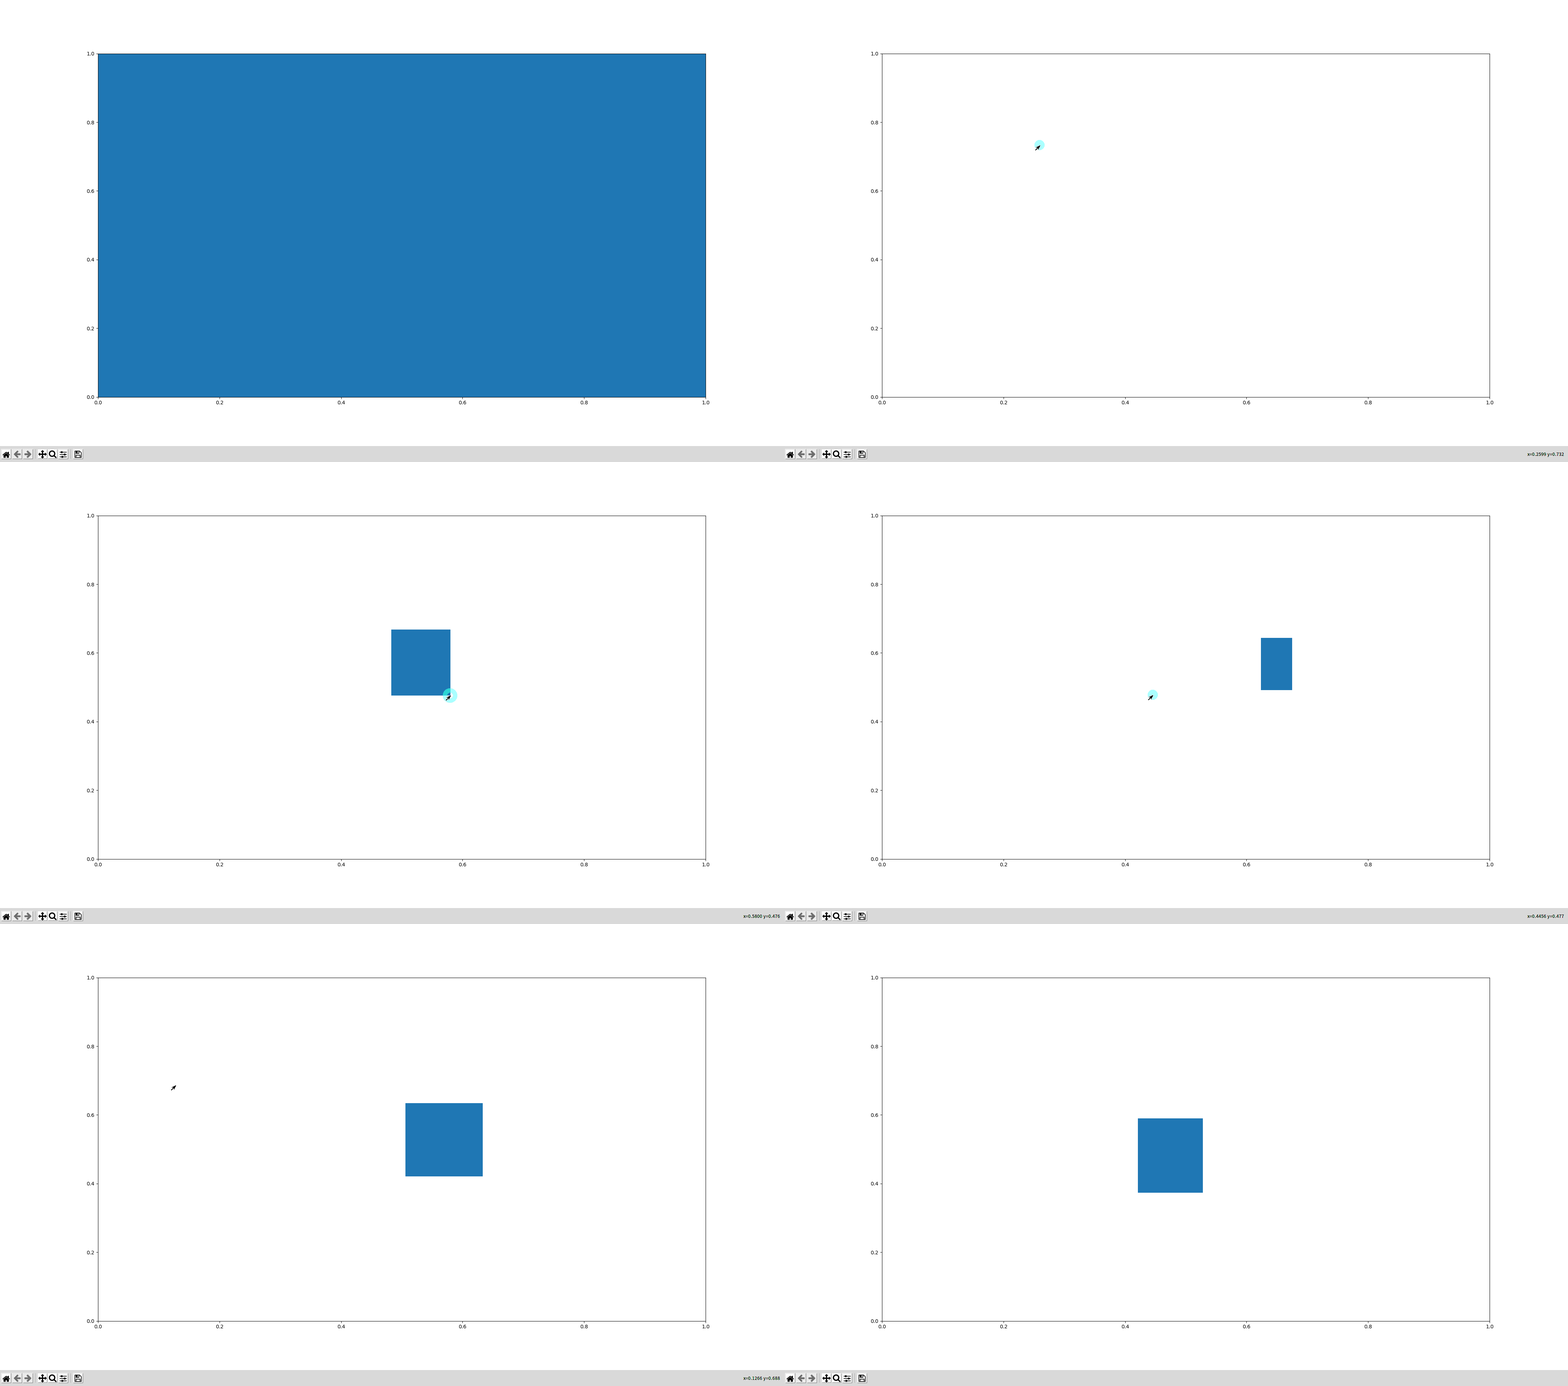
7.1 高级版,点击鼠标,获取两点自动生成矩形
7.2 来源
https://blog.csdn.net/rumswell/article/details/8010166?utm_medium=distribute.pc_relevant.none-task-blog-BlogCommendFromMachineLearnPai2-4.control&depth_1-utm_source=distribute.pc_relevant.none-task-blog-BlogCommendFromMachineLearnPai2-4.control
7.3 代码
import matplotlib.pyplot as plt
from matplotlib.patches import Rectangle

class Annotate(object):
    def __init__(self):
        self.ax = plt.gca()
        self.rect = Rectangle((0,0), 1, 1)
        self.x0 = None
        self.y0 = None
        self.x1 = None
        self.y1 = None
        self.ax.add_patch(self.rect)
        self.ax.figure.canvas.mpl_connect('button_press_event', self.on_press)
        self.ax.figure.canvas.mpl_connect('button_release_event', self.on_release)

    def on_press(self, event):
        self.x0 = event.xdata
        self.y0 = event.ydata

    def on_release(self, event):
        self.x1 = event.xdata
        self.y1 = event.ydata
        self.rect.set_width(self.x1 - self.x0)
        self.rect.set_height(self.y1 - self.y0)
        self.rect.set_xy((self.x0, self.y0))
        self.ax.figure.canvas.draw()

a = Annotate()
plt.show()
7.4 效果图

自己整理并分享出来,供大家学习。
,


